

How to Budget Direct-to-Consumer Ad Spend on Contribution Margin (And Keep Cash Flow Safe)
Gartner’s annual benchmark reports consistently highlight consumer goods (CPG) and retail/D2C as having the highest marketing spend percentages of any industry (up to 25% of revenue), compared to the 7%–10% broad cross-industry average.
However, allocating marketing budgets purely as a percentage of top-line revenue—without accounting for COGS and fixed OpEx—can easily strain cash flow and distort actual profitability.
Why Revenue-Based Budgeting Hides Your True Margin
Top-line budgeting treats all revenue as equal. But if your COGS or operational costs change, top-line budgeting can hide the fact that you are spending yourself into a loss.
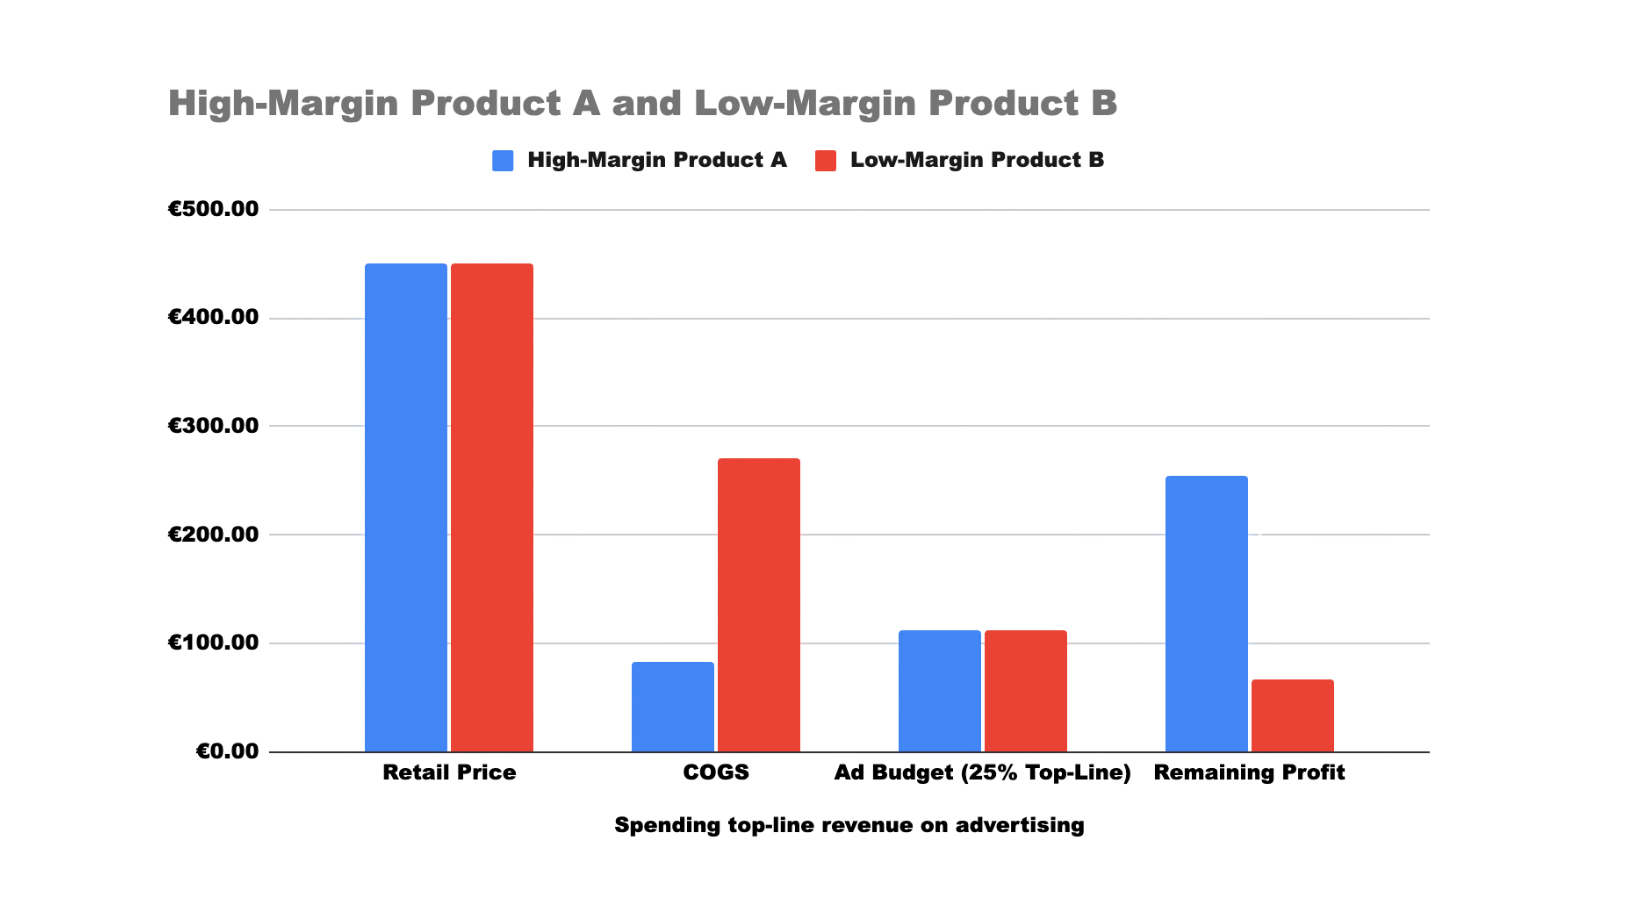
If you set a flat rule like "We spend 25% of top-line revenue on ads," look at what happens when product margins differ:
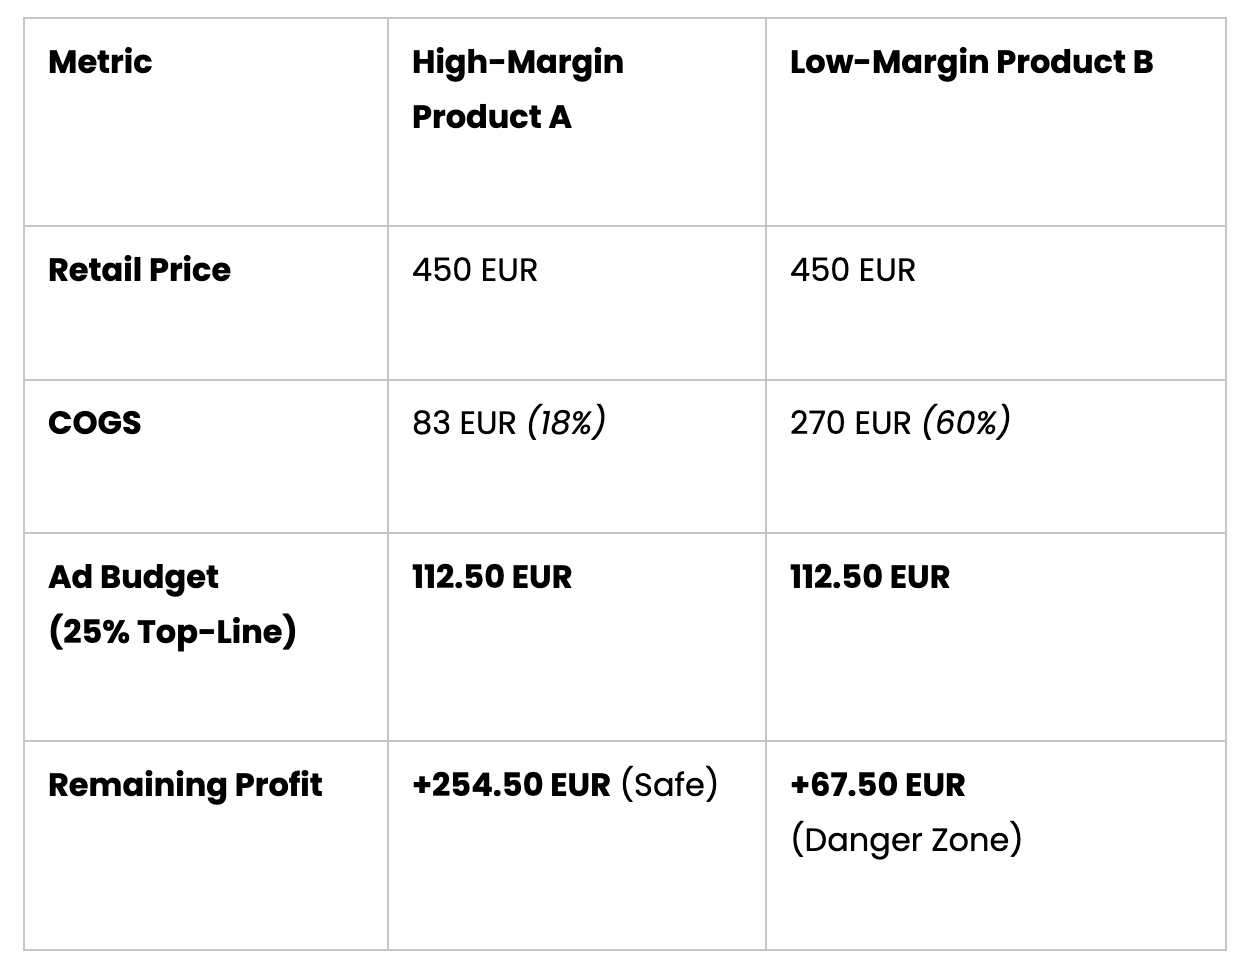
For Product B, that 67.50 EUR profit margin gets completely wiped out once fixed OpEx (salaries, software, rent) is deducted.
Budget Your Ad Spend on Unit Profit, Not Revenue
To protect your cash flow and scale safely, set your marketing budget as a percentage of your unit contribution profit rather than your total top-line revenue. Unit profitability is the actual cash your webshop keeps from a single sale once you deduct every direct expense—from production and shipping to customer acquisition and post-sale support. By knowing the exact amount you retain per order before setting your ad budgets, you guarantee that every sale actively protects your margins and drives real net profit.
Unit Profitability: Example
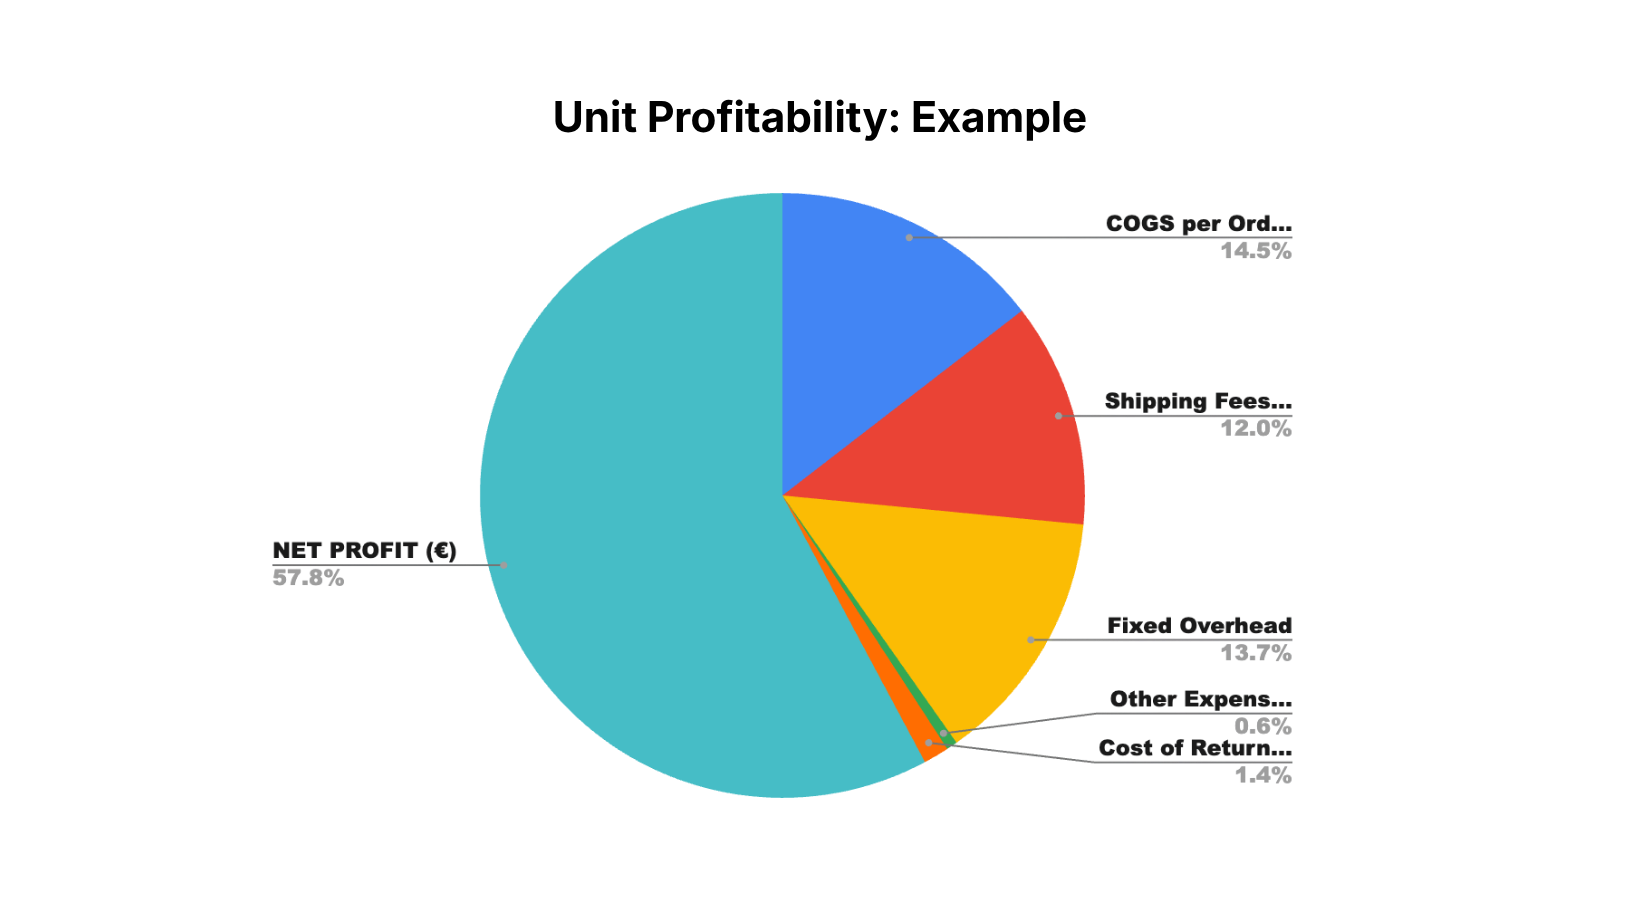
As illustrated in the Unit Profitability pie chart, the entire pie represents 100% of the Average Selling Price, which is divided between individual cost components and the remaining net profit margin:
Direct Product Costs: As shown in the blue slice, COGS per Order (€) accounts for 14.5% of the selling price. Deducting these direct product expenses leaves your initial gross margin baseline.
Variable Operations & Fulfillment: The chart highlights additional variable expenses required to fulfill each order, including Shipping Fees & Delivery at 12.0% (red slice) and Other Expenses (€) at 0.6% (green slice).
Overhead Costs: Operational overhead, captured as Fixed Overhead (yellow slice), represents 13.7% per order.
Returns & Customer Support Costs: Unlike basic models, this breakdown factors in post-purchase operations, where Cost of Returns per Order represents 1.4% (orange slice).
Unit Net Profit: After deducting all operational and variable expense slices—COGS, shipping, overhead, returns, and direct fees—you are left with a strong Net Profit (€) margin, which represents 57.8% of the total selling price (turquoise slice).
P&L Accounting vs. Unit Economics
It is important to distinguish between statutory accounting for official financial reporting and operational tracking for unit economics:
On an official Income Statement (P&L): All marketing costs, software, and salaries are grouped together under Operating Expenses (OpEx). This ensures that COGS reflects only physical product costs, keeping your gross margin clean and standardized.
In Unit Economics: Managers separate OpEx into Variable Costs (CAC, Returns, Shipping)—such as office management, infrastructure, … and Return Cost slices shown in the chart—as Fixed Overhead.
👉 Access the Profit & Loss Tracker to run your calculations.
By visualizing your order breakdown through this structure, you can see how each cost layer impacts your bottom line, ensuring every sale yields a clear 56.6% net profit before you calculate the variable marketing spend.
How to Calculate Your Marketing Budget Based on Unit Profit Allocation
Let's say your pre-marketing profit on a single unit is €56.60 (56.6% of a €100 AOV):
If you decide: "On every unit sold, I want to re-invest 65% of our unit profit pool into ad spend (CAC) to acquire the customer, and keep 35% as final net profit."
Max CAC = 65% x €56.60 = €36.79
Final Unit Net Profit = 35% x €56.60 = €19.81
💡 Because the baseline unit margin is fixed (56.6%), taking a percentage of that specific profit pool works smoothly. It never triggers circular logic or stagnation because you aren't waiting for month-end accounting—it's locked in per order.
Strictly speaking, CAC measures the cost to acquire a brand-new customer. Therefore, Cost Per Order (CPO)—or Ad Spend per Order—is the precise and correct term here.
Setting the Right Baseline: Top-Line Targets vs. Margin Protection
So in short, both paths lead to the exact same monetary outcome on a single unit. But remember: while the math ends up in the exact same spot (€36.80), how you set the baseline completely changes the strategic mindset and decision-making of the person managing the business.
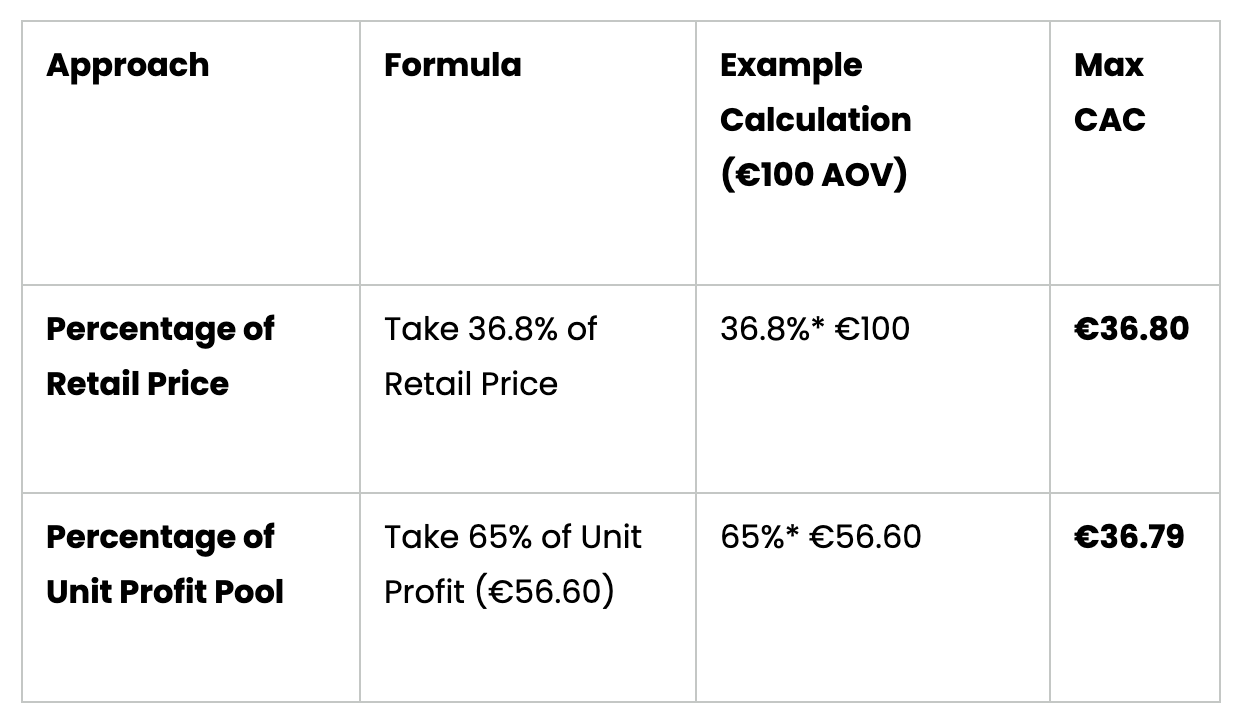
💡Taking a percentage directly of the unit's profit pool makes complete sense when modeling unit economics—it gives you a clear split of how much value a single order generates versus how much of that specific order's value you're willing to sacrifice to acquire it.
Variable vs. Fixed: The Financial Framework for Scaling D2C Profit
As a D2C brand owner, how you classify your ad spend fundamentally changes how you run your business. In standard financial accounting (OpEx), marketing is often lumped into fixed operating expenses right alongside rent and software subscriptions—which works fine for taxes, but distorts your daily operations. To truly master your unit profitability, you have to treat direct performance ad spend as a variable cost (Cost Per Order), because every single unit sold requires a direct sacrifice of advertising dollars to trigger that order.
True fixed overhead—like your core team's salaries, agency retainers, and office space—stays constant regardless of sales volume, but your performance spend scales linearly with your revenue. Keeping these two buckets strictly separate prevents you from falling into the trap of cutting performance budgets to save "overhead," and gives you the exact pre-marketing margin you need to scale your ads safely without secretly eroding your net profit.
How Tech Infrastructure Directly Drives Lower Customer Acquisition Costs
Keep both (Fixed Overhead versus Variable Marketing Spend) in mind. Infrastructure, for example, shouldn't be viewed purely as a Fixed Overhead OpEx cost. When tied directly to performance, tech upgrades act as a Conversion Rate Multiplier (see Chapter about Infrastructure).
If upgrading your checkout or speed infrastructure lifts your overall conversion rate from 2.0% to 2.4%, your Customer Acquisition Cost (CAC) drops significantly. That extra margin goes straight back into your pre-marketing profit pool—giving you more breathing room to scale your ad spend safely.
The Limits of Low CAC: Why Scale Requires Higher Acquisition Costs
However, chasing a low CAC is easy if you simply squeeze your ad budget and target only hyper-warm, low-hanging fruit (e.g., retargeting or brand search). The moment you scale performance marketing spend to reach new audiences, cold-traffic CAC goes up. Winning in e-commerce isn't about having the prettiest percentage margins; it’s about collecting the highest volume of actual cash at the end of the month.
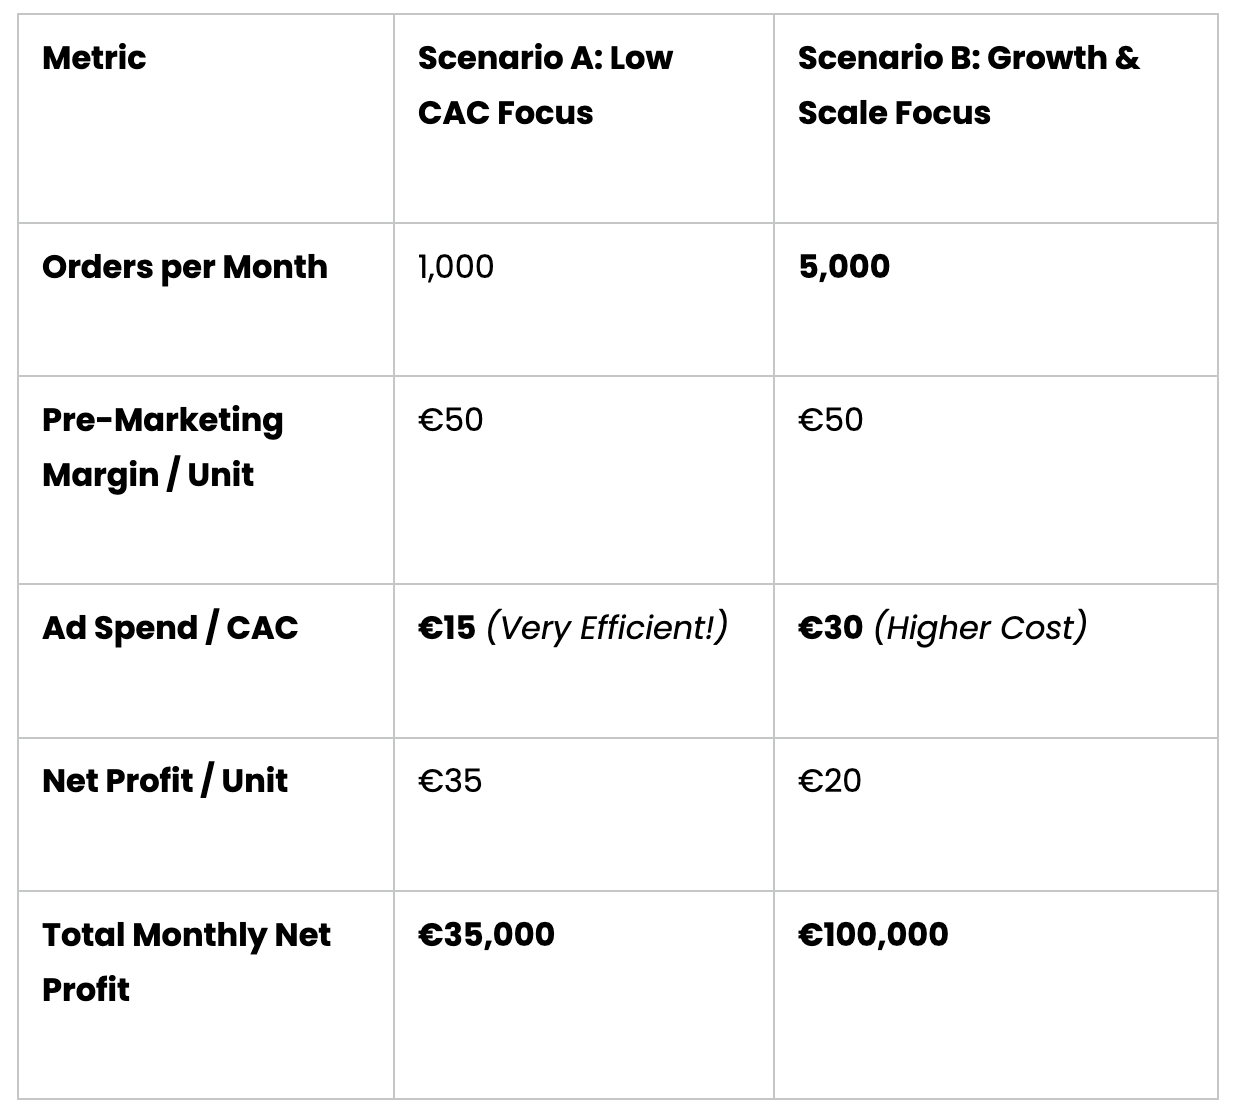
Even though Scenario B has a 100% higher CAC and a lower profit margin per unit, it brings in almost 3x more total profit to the business.
💡Strategic Priority #1 isn't "minimizing CAC"—it's maximizing the gap between your Pre-Marketing Margin and your CAC, then scaling that gap across as many orders as possible.
In other words: Your main goal isn't to get the cheapest customers—it's to make as much profit as possible on each sale, and then get as many sales as you can.
Upgrading your infrastructure and conversion rate gives you a huge pre-marketing margin buffer. You can use that buffer to swallow a higher CAC, outbid your competitors on ad platforms, unlock massive volume, and build a far larger business.
💡First-Purchase Product Type is one of the strongest predictors of retention. Learn how in the E-Com Hub.